Sydney’s Burglary Statistics with Christmas Around the Corner | Alarm Services Sydney
- 10Dec
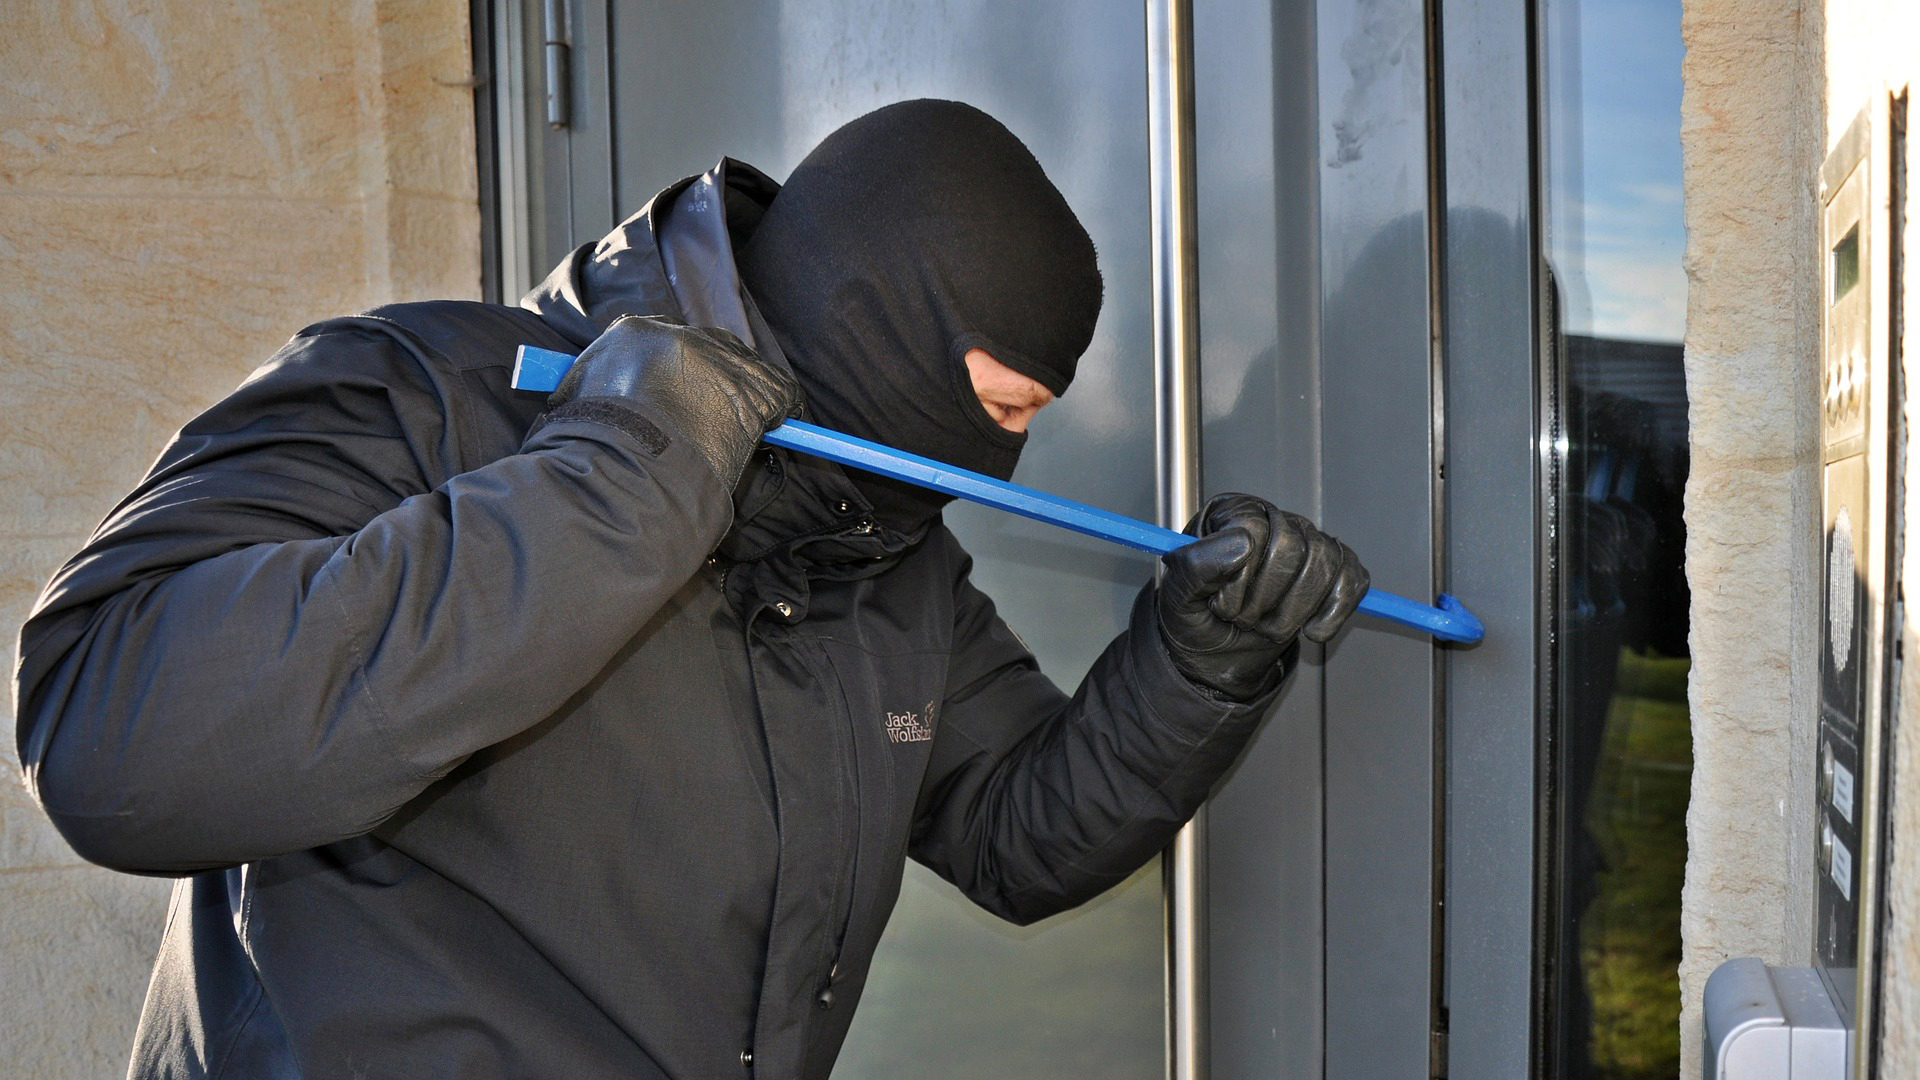
Did you know that Property-related Crime Increases Around Christmas?
It’s no surprise that criminals take advantage of the festive season, most notably the fact that so many Sydney Siders and other Australians go travelling to see family and friends for lengthy periods of time.
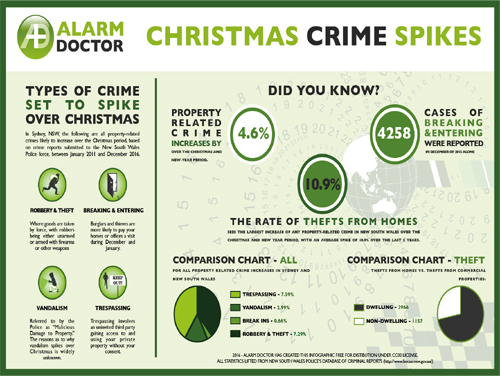
On average, over the last five years (from January 2011 to December 2015), the rate of property-related crimes, such as burglary, breaking and entering, trespassing and vandalism has increases by a drastic 4.6% between 1st December and 31st January, compared to the rest of the year, with the rate of theft from homes as high as 10.9%.
Trespassing also sees a significant increase, with a monthly average of 758 cases between February and November, compared to an average of 815 cases over December and January – a total increase of 7.59%.
Why does the rate of trespassing increase? It is our professional opinion that this spike is not due to the fact that more people are unintentionally stepping “out of bounds,”, but the fact that more potential burglars and thieves are being caught “scouting” before they go on to rob the properties in question.
Did you know that you could come home to a fine from the local council if your alarm has been causing too many issues for the neighbourhood?
Are You Planning on Going Away This Christmas or New Year?
If you are planning on leaving your home or office in Sydney to enjoy Christmas or the New Year celebrations, we highly recommend that you have Alarm Doctor service your systems before you go!
Professional burglars target properties that have security issues or alarm faults because they understand that the Police will also be aware of these issues, making it less likely for the Police to be called out to another “false” alarm. Especially over the Christmas season as more and more people leave the comfort of their homes.
Our technicians cover all of New South Wales, and they’ll be sure to look over all of the following so that your security systems are fully functional and primed to protect your property while you’re away:
- Installations and Upgrades
Alarm Doctor specialises in providing homes and offices across Sydney with some of the most highly-regarded alarm installation and upgrade services the region has to offer.If you’re going away this Christmas and you know that you don’t have a working alarm system installed in your property or you think the one you’ve got looks a little worse for wear, then it’s time to get in touch with the doctors.All of our technicians arrive fully equipped, so we’ll be able to have you up and running in as little as an hour, depending on the size of your property. Call us today on 1300 23 00 23 and we’ll have you protected in a jiffy, and for as little as $150 +GST, saving yourself from a Christmas nightmare couldn’t be more worth it.
- Back-up Battery Checks and Replacements
Your alarm system’s back-up battery is the only thing stopping your system from shutting down in the event of a power cut. Outages aren’t always what you might expect either, criminals are just as good as cutting power to homes as engineers and road maintenance services are!Back-up batteries are designed to keep your system powered for up to 8 hours in the event of a power cut – but due to their high output, back-up batteries of all makes and brands are prone to fatigue and failure if ignored too long.
If you haven’t had your back-up batteries checked or serviced in the last 6 months, we highly recommend that you get in touch with us today so that we can book you in for a pre-Christmas inspection!
- Keypad Error Log Analysis
Your system’s keypad does a whole lot more than just make a terrible sound when it encounters an error!Every error has a code associated with it that can inform alarm professionals as to what potential problems your system could have developed since its last inspection.
If you haven’t had your alarm or security systems serviced recently, you may be unaware of a potential fault on your system.A fault doesn’t necessarily mean a guaranteed burglary, but it can lead to a lot of noise pollution for your neighbours if your system sets off false alarms while you’re gone.
- Auxiliary Connection Inspections
Just because everything looks and sounds like it’s doing its job doesn’t mean it is, necessarily. Depending on how long its been since your last alarm service, or who installed the system originally, certain auxiliaries may have come loose or never been properly connected in the first place.Our technicians will run a detailed inspection over all of the wiring on your system and compare what we see to the services you’re expecting your system to provide. For example, if we can see that you have five motion sensors around your property, but only three connected to your control panel, that would be a potential problem that needs attention.
- Professional Testing
Alarm Doctor’s technicians will always ensure that every element of your alarm or security systems are working at their best before we leave the premises – this may seem like an obvious thing to do, but you’ll be surprised as just how many installers simply set everything up and hop off to the next job.It is essential that you have your systems checked over with a keen, professional eye because alarm systems are ultimately quite complicated pieces of kit and, if anything goes wrong with it, it might be some time before you know about it; all the while being less than protected.
Book A Service from Alarm Doctor
Now’s your chance to have Alarm Doctor’s professional technicians pay you a visit at an even better rate!
Whether you’re looking to have us install a completely new alarm system, run some basic maintenance, provide you with essential repairs or even replace your back-up battery, you’ll be able to knock a whole $5.00 off your service fee, just by liking our Facebook page!
Is a Facebook like really worth $5?
We’re new to Facebook, but not to the market and we’ve always prided ourselves on great customer service.
We’ve never had the chance to reward our customers in such an effective way before, but now, granted the tools of Social Media, we’re able to give our customers even more than ever before.
Our Facebook page is going to have a host of useful information, interesting articles, fun facts, crime statistics, do-it-yourself hints and tips, competitions and more over the coming months, so keep your eyes peeled and thanks if you’ve already hit that like button!
Please have a look at our Facebook if you haven’t already, hit “like” and you’ll have saved yourself an instant $5 the next time you need a service – it’s a life-long pact too, so as long as you continue to like the page, you’ll continue to get your $5 off for each booking! Click here to visit.
More on the Christmas Crime Spike
Here is a breakdown of the most common property-related crimes, their incident count over the course of December (Christmas) and January (New Year) compared to the average month, for each year from 2011 to 2015:
|
|
Number of Reports: |
||||
|
Detail |
2011 |
2012 |
2013 |
2014 |
2015 |
| Breaking & Entering (Dwelling) | |||||
| 1st December – 31st January. Ave. | 3248 | 3394 | 2956 | 2892 | 2786 |
| Average per month | 3295 | 3383 | 2940 | 2832 | 2631 |
| Difference | -1.45% | +0.2% | +0.5% | +2.1% | +5.67% |
| Break & Enter (Non-Dwelling) | |||||
| 1st December – 31st January. Ave. | 1572 | 1331 | 1092 | 1080 | 919 |
| Average for rest of the year (per month) | 1423 | 1358 | 1218 | 1066 | 990 |
| Difference | +10.4% | -2.0% | -10.4% | +1.3% | -7.1% |
| Stealing (Theft) from a Dwelling | |||||
| 1st December – 31st January. Ave. | 1997 | 2090 | 2034 | 1997 | 1889 |
| Average for rest of the year (per month) | 1740 | 1824 | 1804 | 1866 | 1785 |
| Difference | +14.8% | +14.6% | +12.7% | +7.0% | +5.8% |
| Stealing (Theft) from a Business / Store | |||||
| 1st December – 31st January. Ave. | 1807 | 1878 | 1797 | 1734 | 2032 |
| Average for rest of the year (per month) | 1733 | 1835 | 1821 | 1715 | 1829 |
| Difference | +4.2% | +2.3% | -1.3% | +1.1% | +11.1% |
| Malicious Damage to Property | |||||
| 1st December – 31st January. Ave. | 7752 | 6906 | 6392 | 5847 | 5613 |
| Average for rest of the year (per month) | 7262 | 6897 | 6355 | 5684 | 5323 |
| Difference | +6.7% | +0.1% | +0.6% | +2.9% | +5.4% |
| Trespassing | |||||
| 1st December – 31st January. Ave. | 820 | 795 | 802 | 778 | 880 |
| Average for rest of the year (per month) | 735 | 755 | 738 | 747 | 785 |
| Difference | +11.5% | +5.3% | +8.7% | +4.1% | +12.1% |
Cells containing a plus, “+“ sign indicate an increase in reports for that particular crime, compared to the average monthly rate of the same crime being reported. Cells containing a minus, “-” sign are those whose rates fell in comparison to the average monthly rate in that year.